Angular Velocity Control
First, I had to figure out a way to get the robot to spin at a consistent rate at a fixed spot. To do this, I wrote code that implements a P controller to control the robot's angular velocity. I tried adding integration and derivative control but just a simple P controller seemed to work the best. Here is the code that implements a P controller to control the angular velocity:
I set the target angular velocity to be -20 degrees per second. Negative angular velocity corresponds to clockwise rotation. Also note that I had to add a conditional statement to prevent the robot from turning too fast at the beginning due to the spike in error at t=0.
To prove that this works, here is a video of my robot turning at approximately 20 degrees per second:
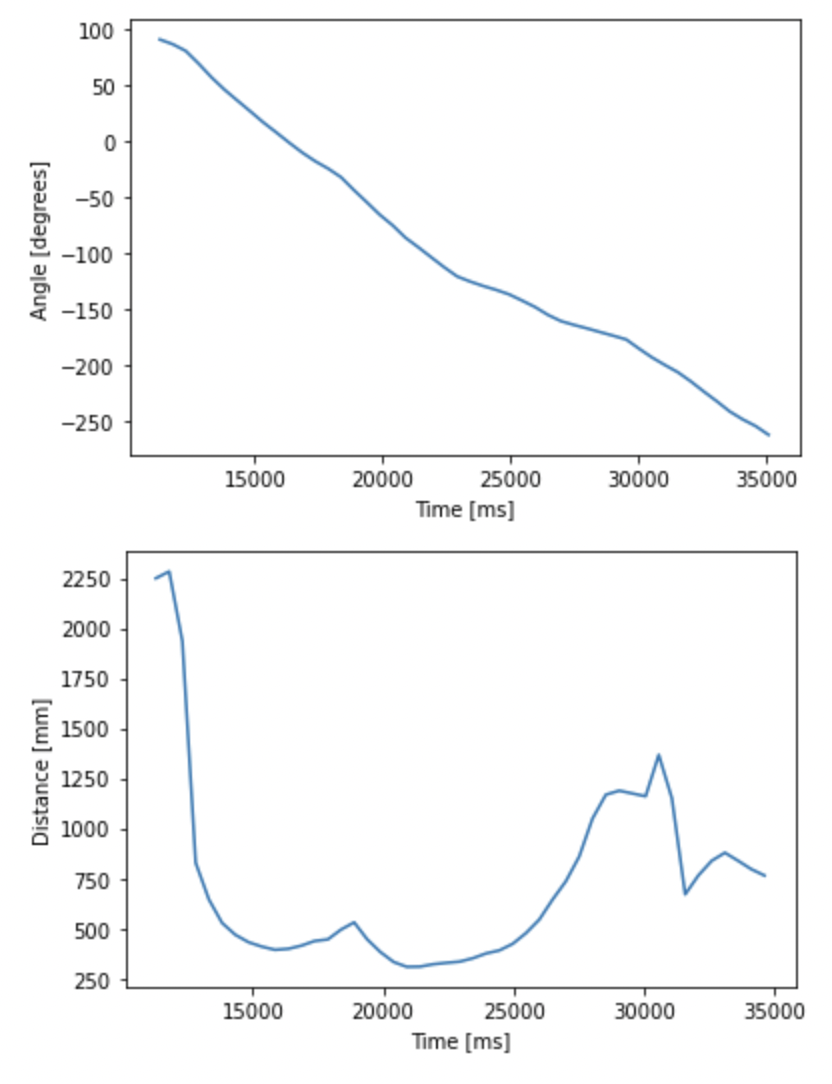
As you'll see in the plots for time vs. yaw in the next section, the controller worked surprisingly well despite its simplicity.
Mapping using TOF Readings
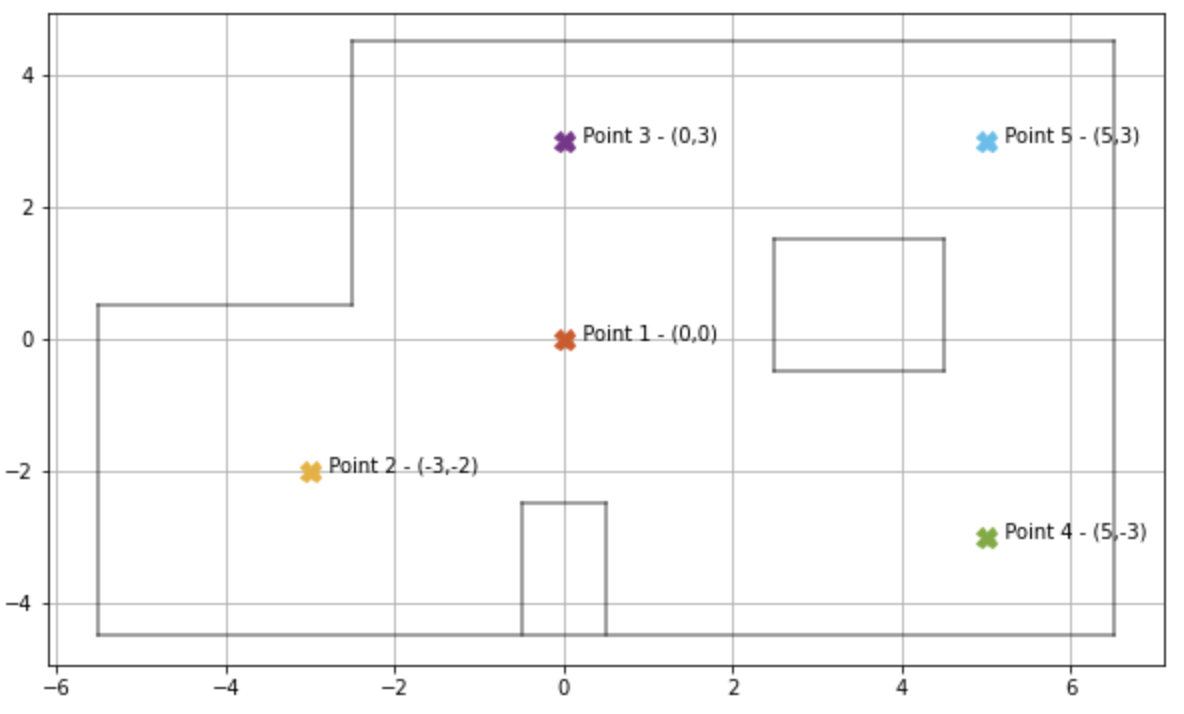
To map the lab room, I placed my robot at four designated points within the room. The coordinates for the four points were (5,-3), (5,3), (0,3), and (-3,-2) where the coordiantes are in units of tiles on the floor of the lab room. Each tile has a dimension of 1 foot x 1 foot.
Here is a true map of the lab room that Aryaa Pai (student from last year) had made:
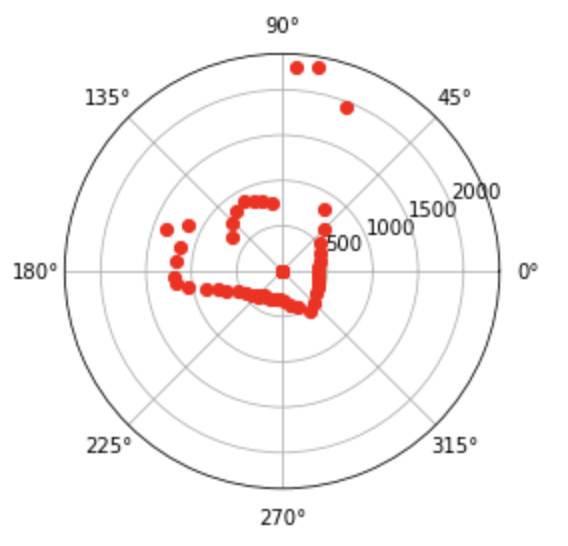
At each of the four points, my robot read out distance readings using the TOF sensor as it rotated 360 degrees at the designated points (using the code written in the previous section). I also changed the target rotation rate to 30 degrees per second to speed things up. I recorded IMU and TOF measurements every 0.5 seconds and plotted them.
Plots for location 1 (5,-3):
Plots for location 2 (5,3):
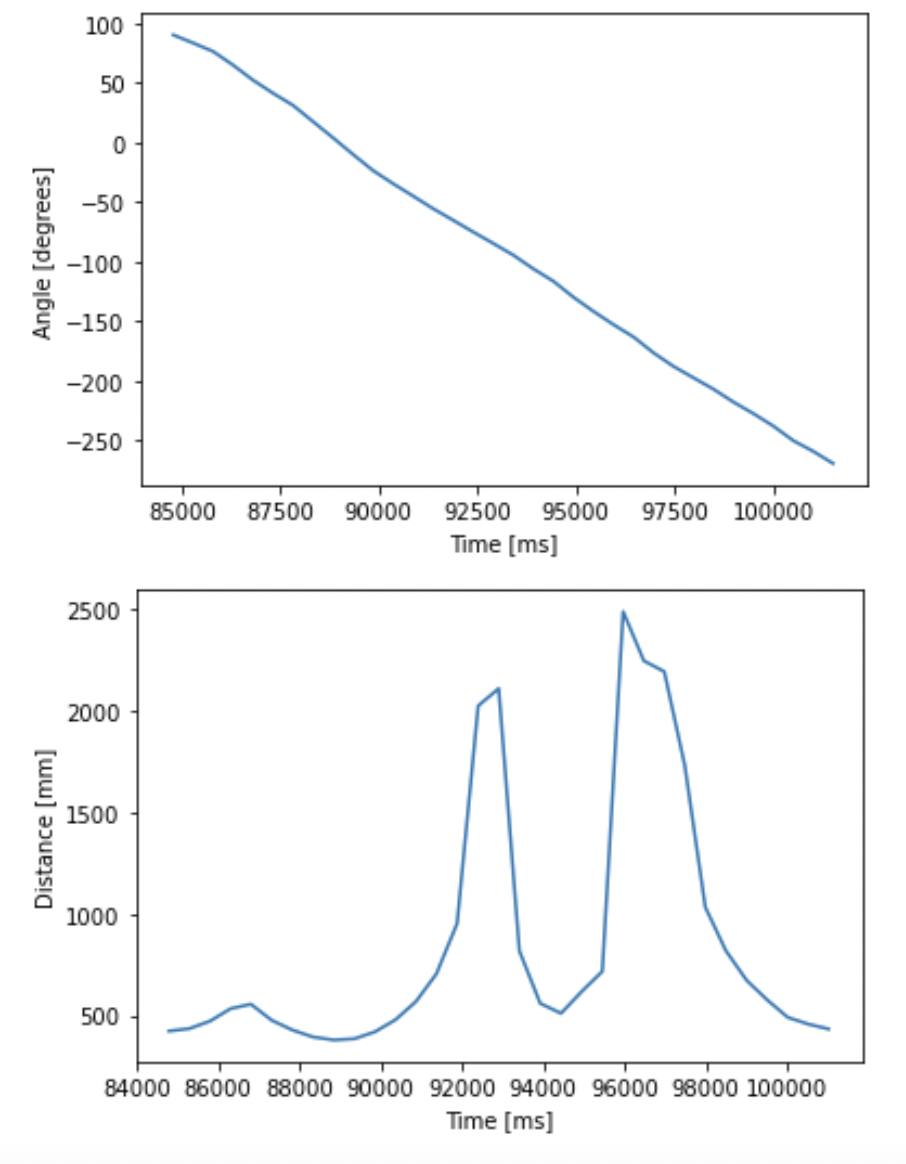
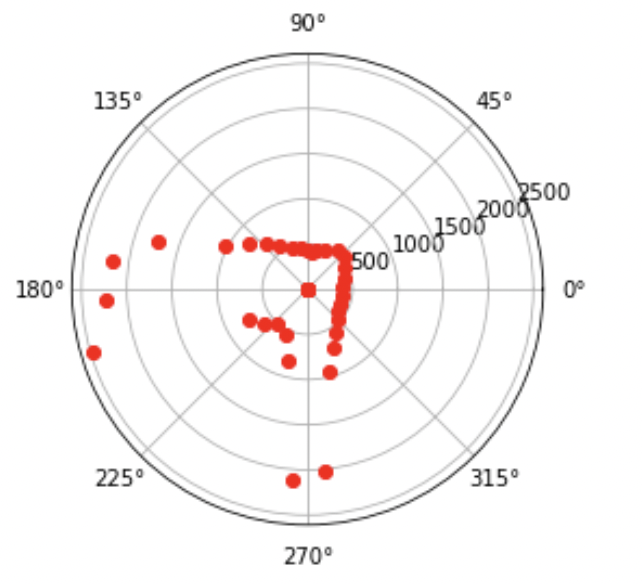
Plots for location 3 (0,3):
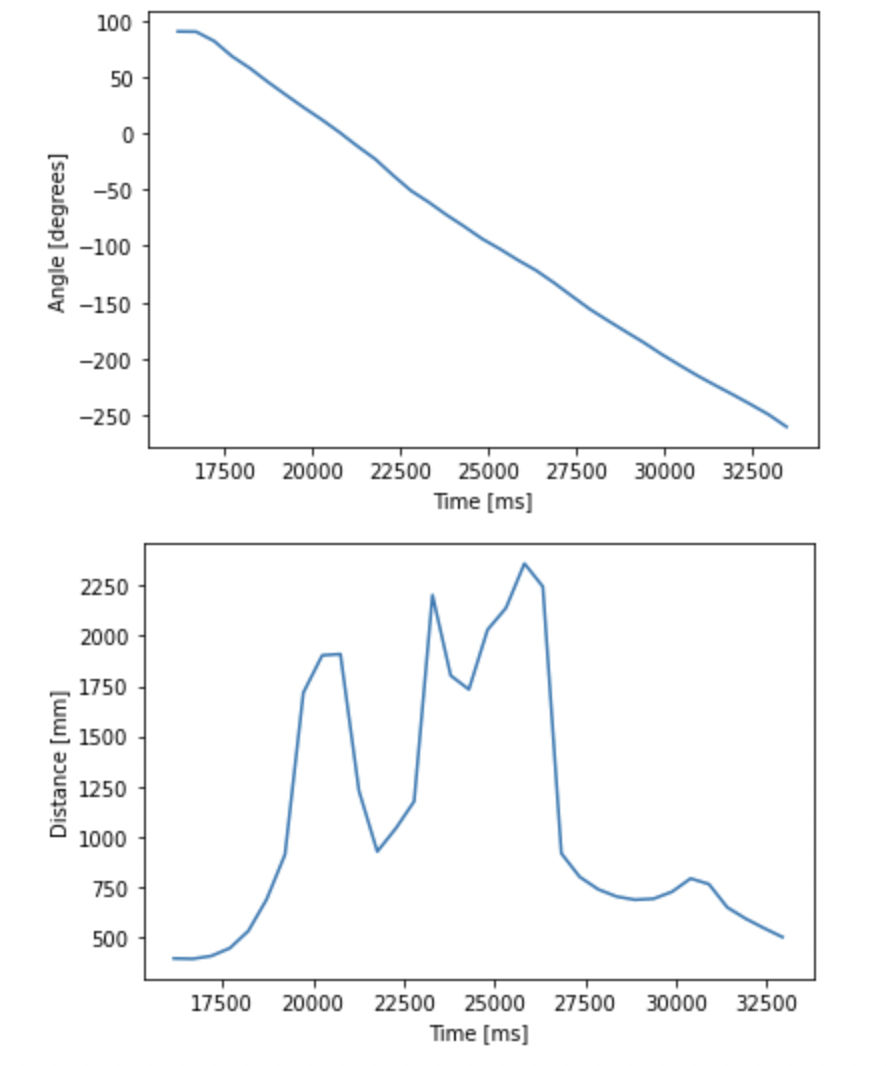
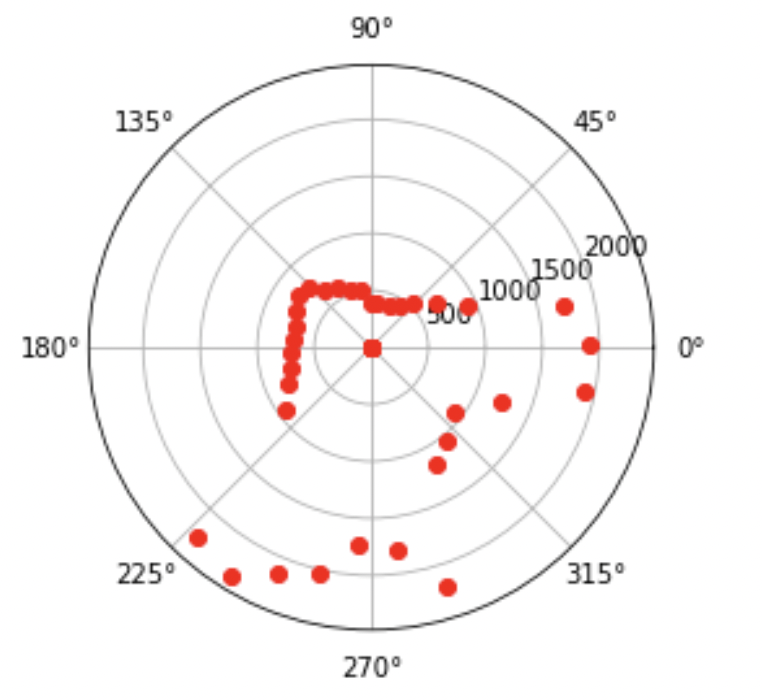
Plots for location 4 (-3,-2):
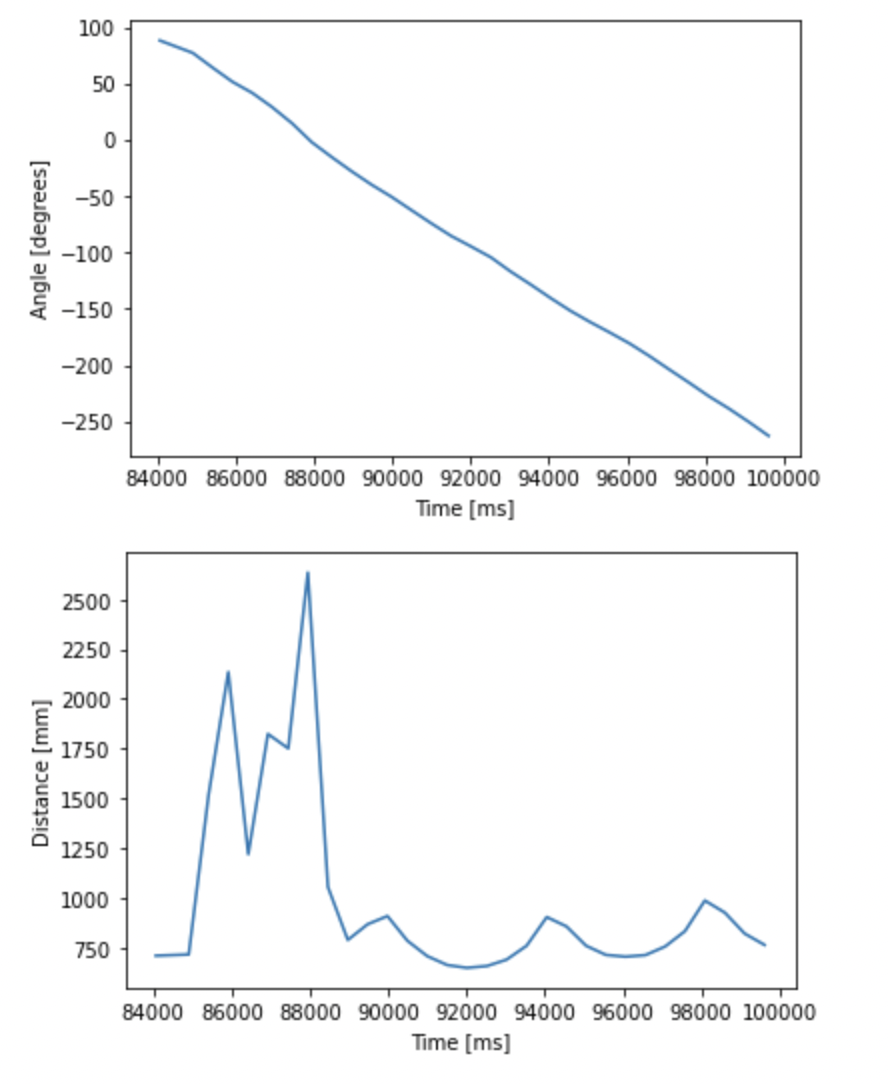
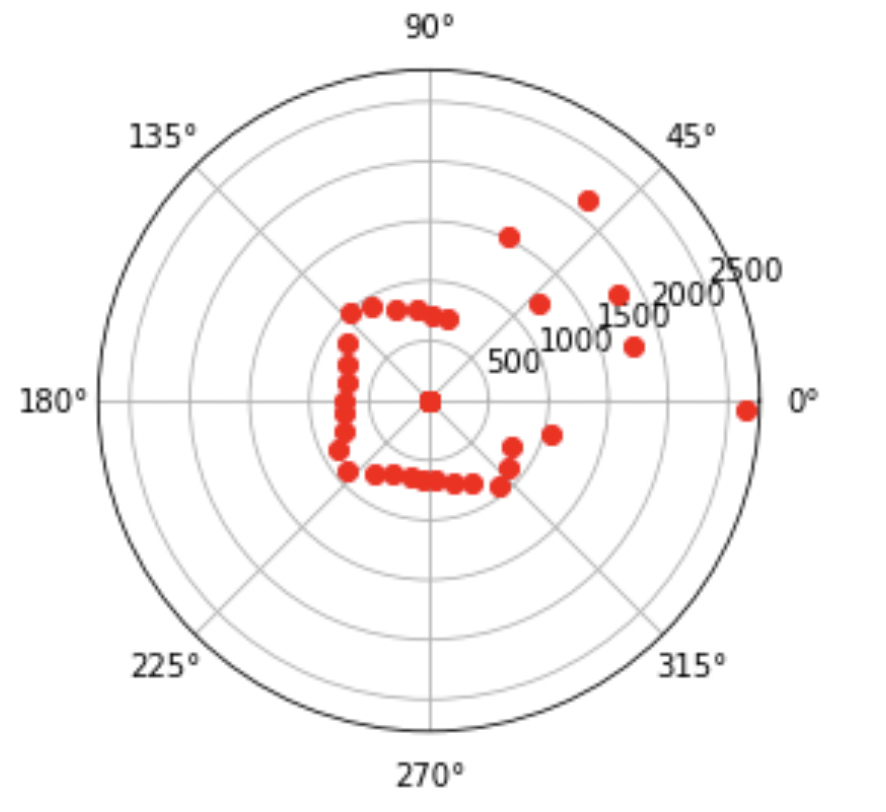
The points on the polar plots are a little sparser than I would have liked. This could be improved by logging the sensor measurements more frequently (for example, insteady of logging it every 0.5 seconds, log it every 0.1 seconds) to increase the density of the points.
Next, I had to merge these four polar plots into a single Cartesian plot. The mapping from r-theta space to x-y space is as follows:
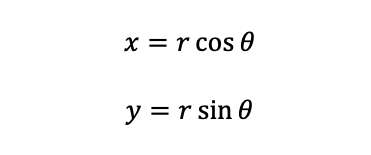
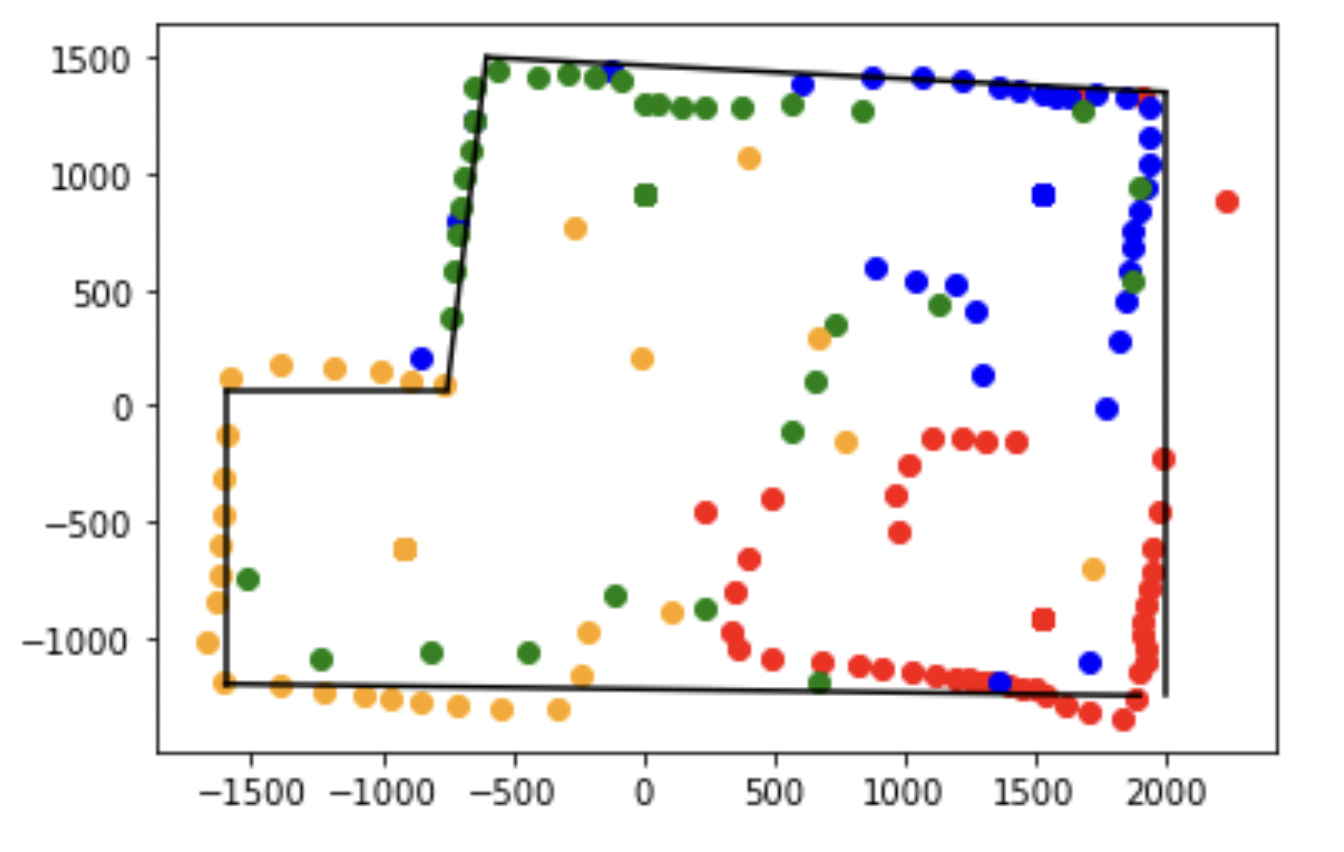
Using this mapping, I merged to four plots together into one single map. Here is the map that resulted from merging the four together:
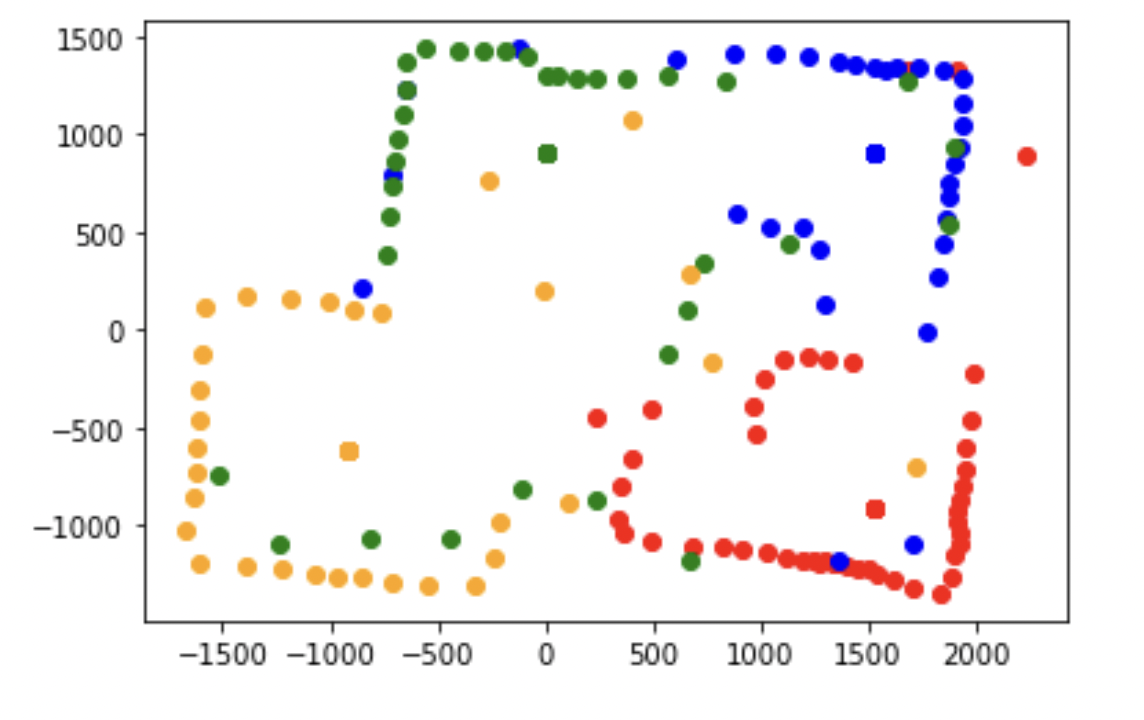
The generated map looks reasonably accurate except the robot couldn't accurately map the box in the middle of the room. Next, I generated a line-based map based on this merged map:
