Setting up the IMU
First I had to physically connect the IMU sensor to the Artemis board using an I2C cable. Here is a picture of the IMU hooked up to the Artemis board.

Then to test that the IMU was connected properly to the Artemis, I ran the example code from the sensor’s library (Example1_Basics). Running the example code outputted the following.

Here is a plot of the acceleration and angle data that makes it easier to visualize the sensor data.
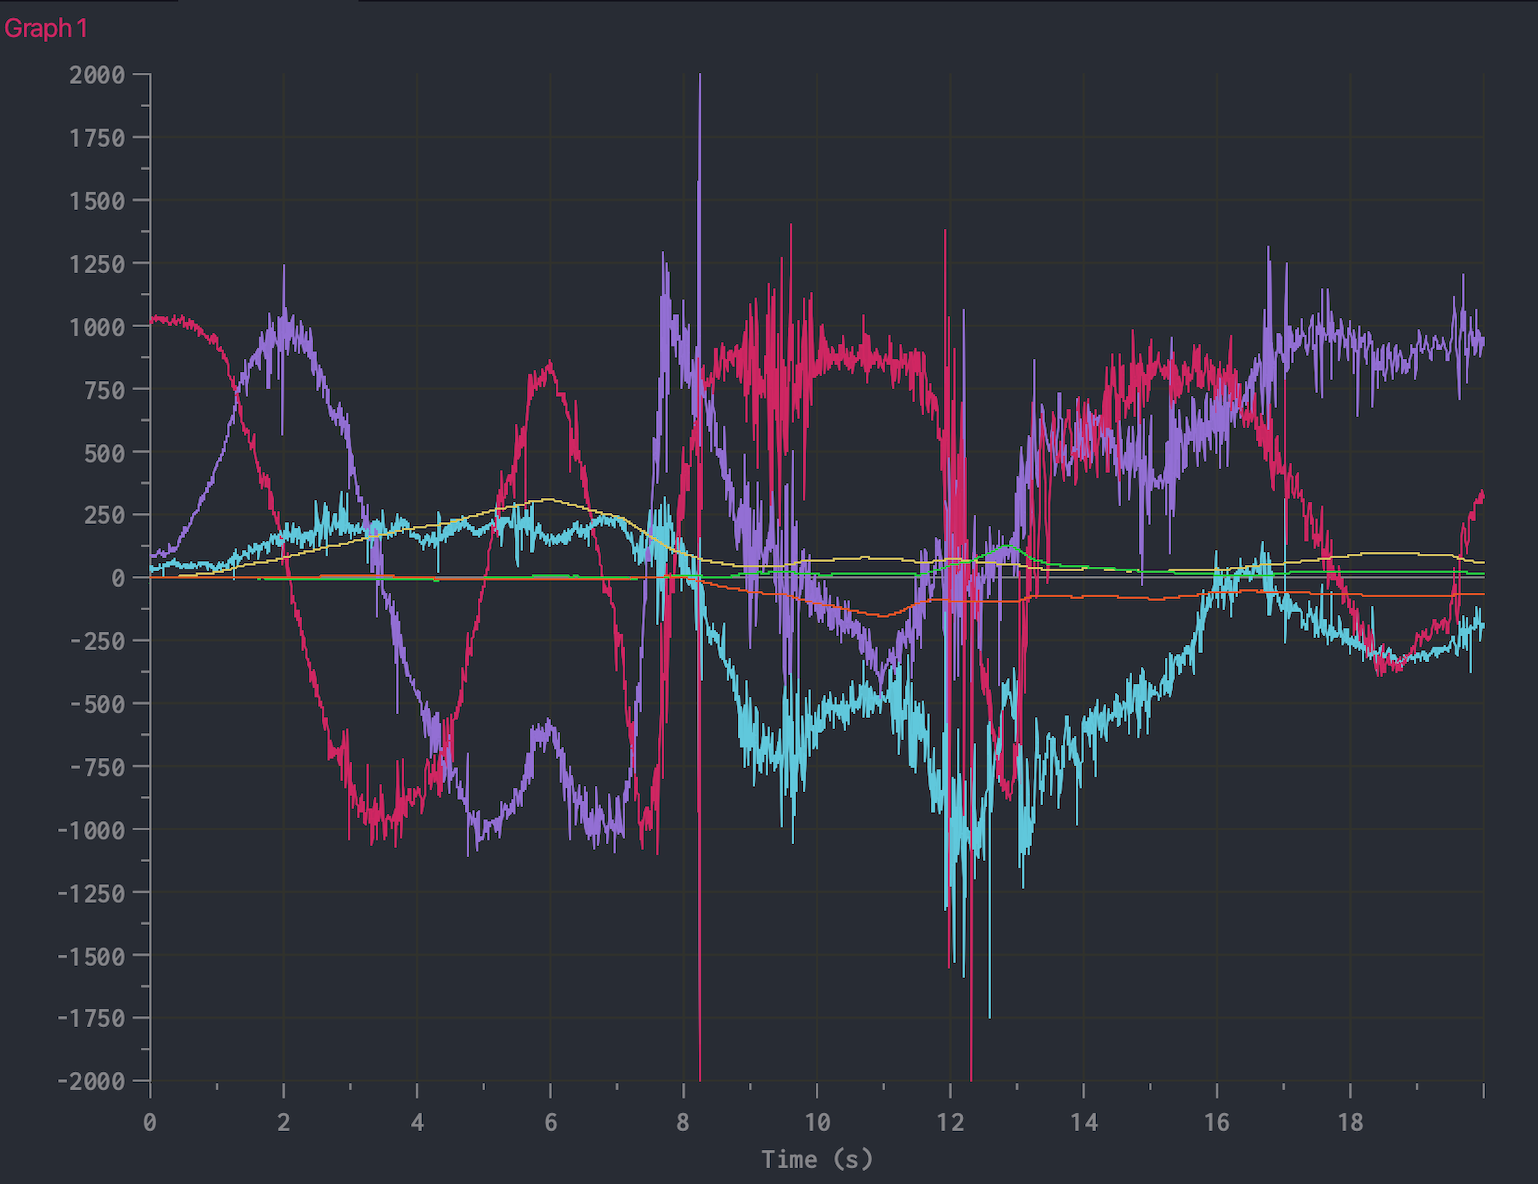
The pink, purple, cyan curves are the accelerometer data. The green, yellow, red curves are the angle data. It can be seen that the accelerometer data is much noisier than the gyroscope data. This will have implications on angle (pitch, roll, yaw) calculation in the later tasks.
Note that the variable AD0_VAL should be set to 0 in the code because the ADR jumper is closed. The value of AD0_VAL is supposed to represent the last bit of the I2C address.
Working with accelerometer data
Using the accelerometer on the IMU, I calculated the pitch and roll (can’t calculate yaw using accelerometer) using the following equations.
Here is the code that implements these equations to calculate pitch, roll, and yaw.
Note that it's impossible to determine the yaw using accelerometer data because gravity always points downwards.
Here is a video of the outputs (pitch and roll calculated using the equations above) printing to the serial monitor.
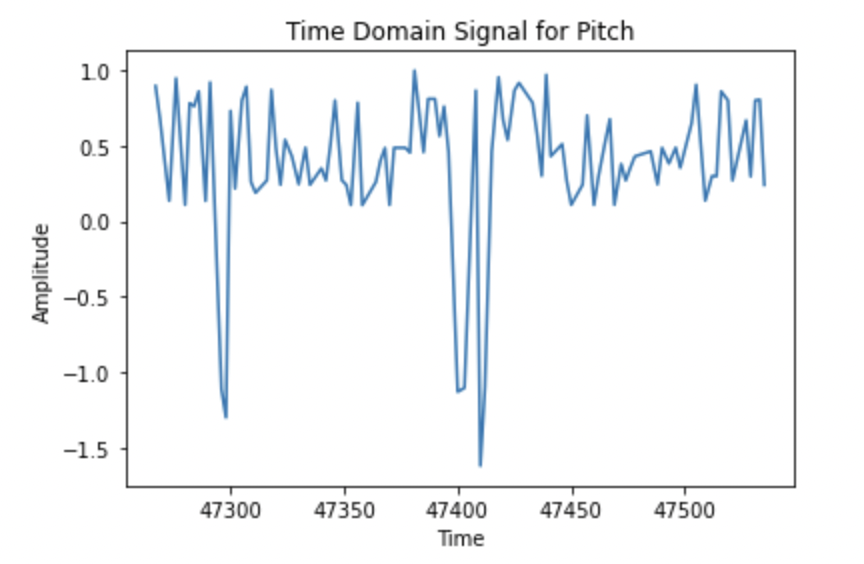
Next, I analyzed the noise in the angle calculated from the accelerometer data by performing a Fourier transform. First, I gathered 200 data points (i.e. 100 pitch angles, 100 roll angles) from the sensor and plotted them in the time domain.
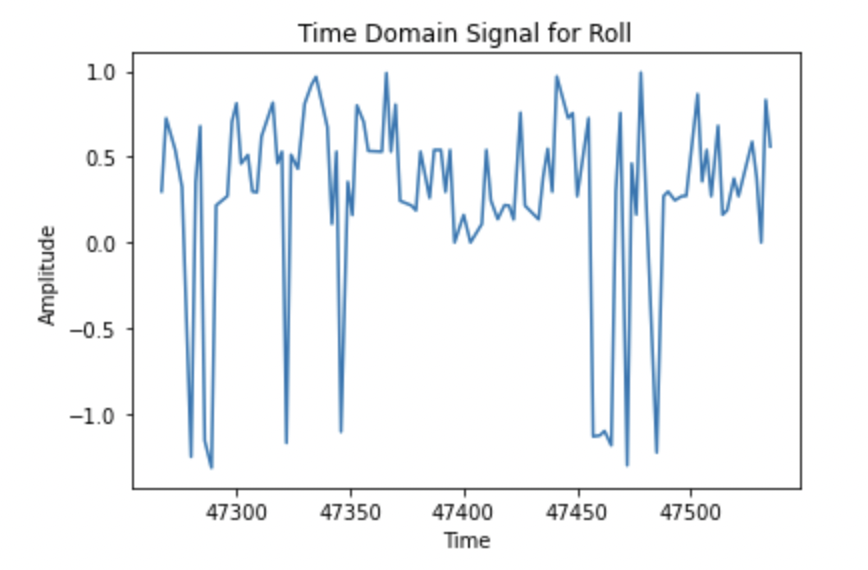
Then I performed a Fourier transform on thea angle data and plotted the data in the frequency domain.
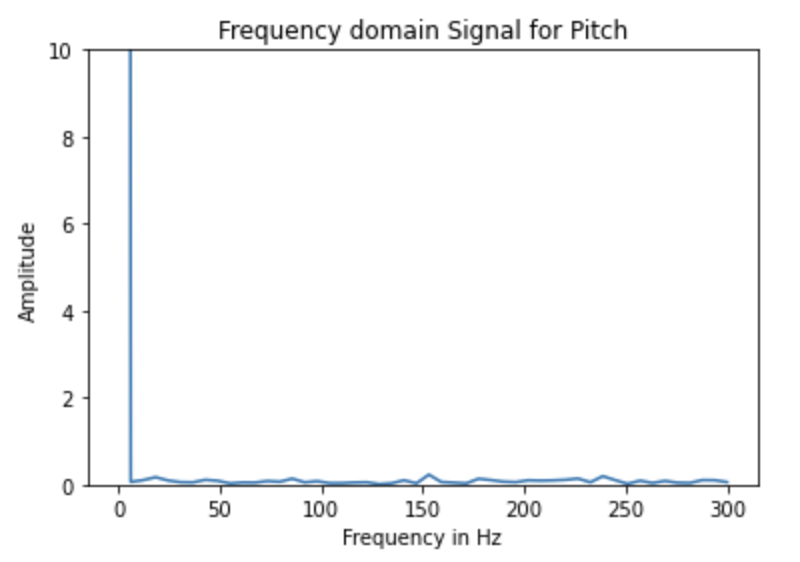
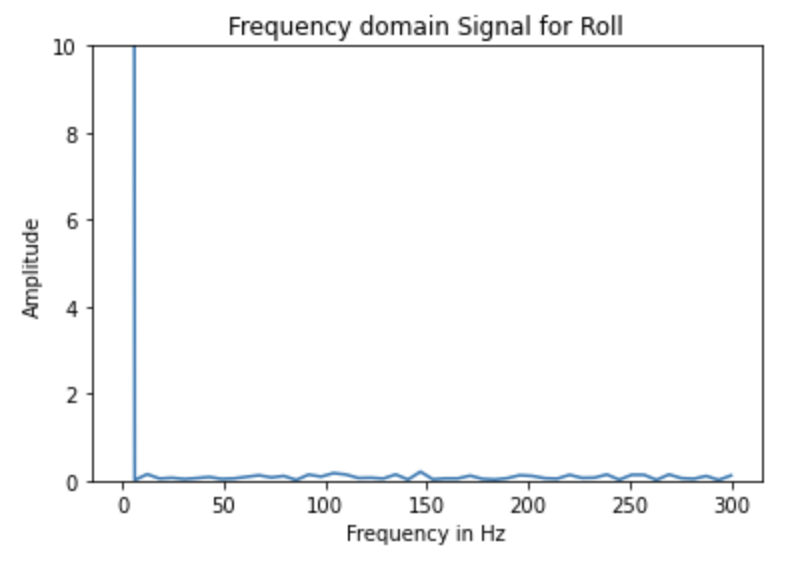
From the frequency domain data, it can be seen that the the angle data doesn’t contain very much high-frequency noise.
Working with gyroscope data
Gyroscope measures angular velocity. To get the angle from the angular velocity readings, I numerically integrated the angular velocity. The code for computing the angle from angular velocity is below.
To test that this outputs realistic results, I held the IMU at various orientations and plotted the angle versus time.
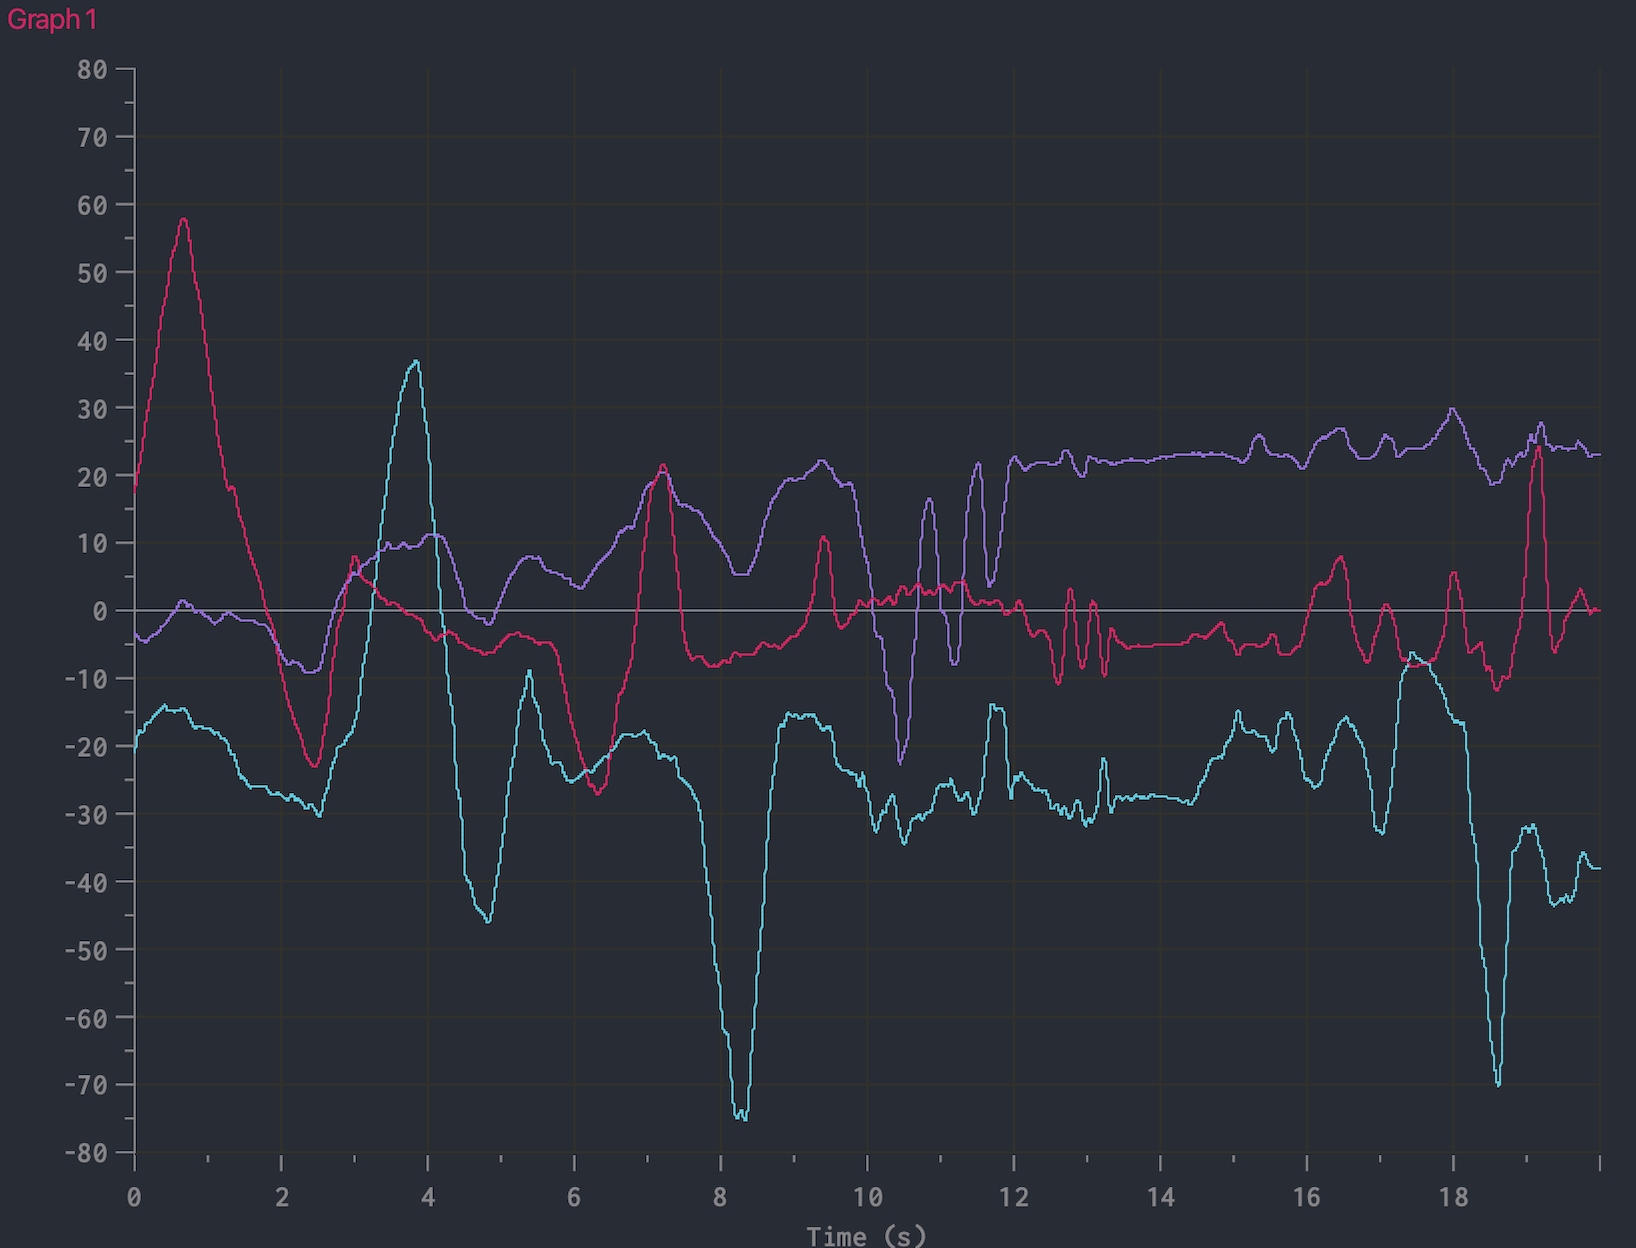
You can see that the angle changes smoothly. However, gyroscopes are vulnerable to drift. That is, because we are integrating, the error in our angular velocity readings accumulates over time. Here is a plot that demonstrates gyroscope drift (I left the IMU flat on the table and recorded the angle data).
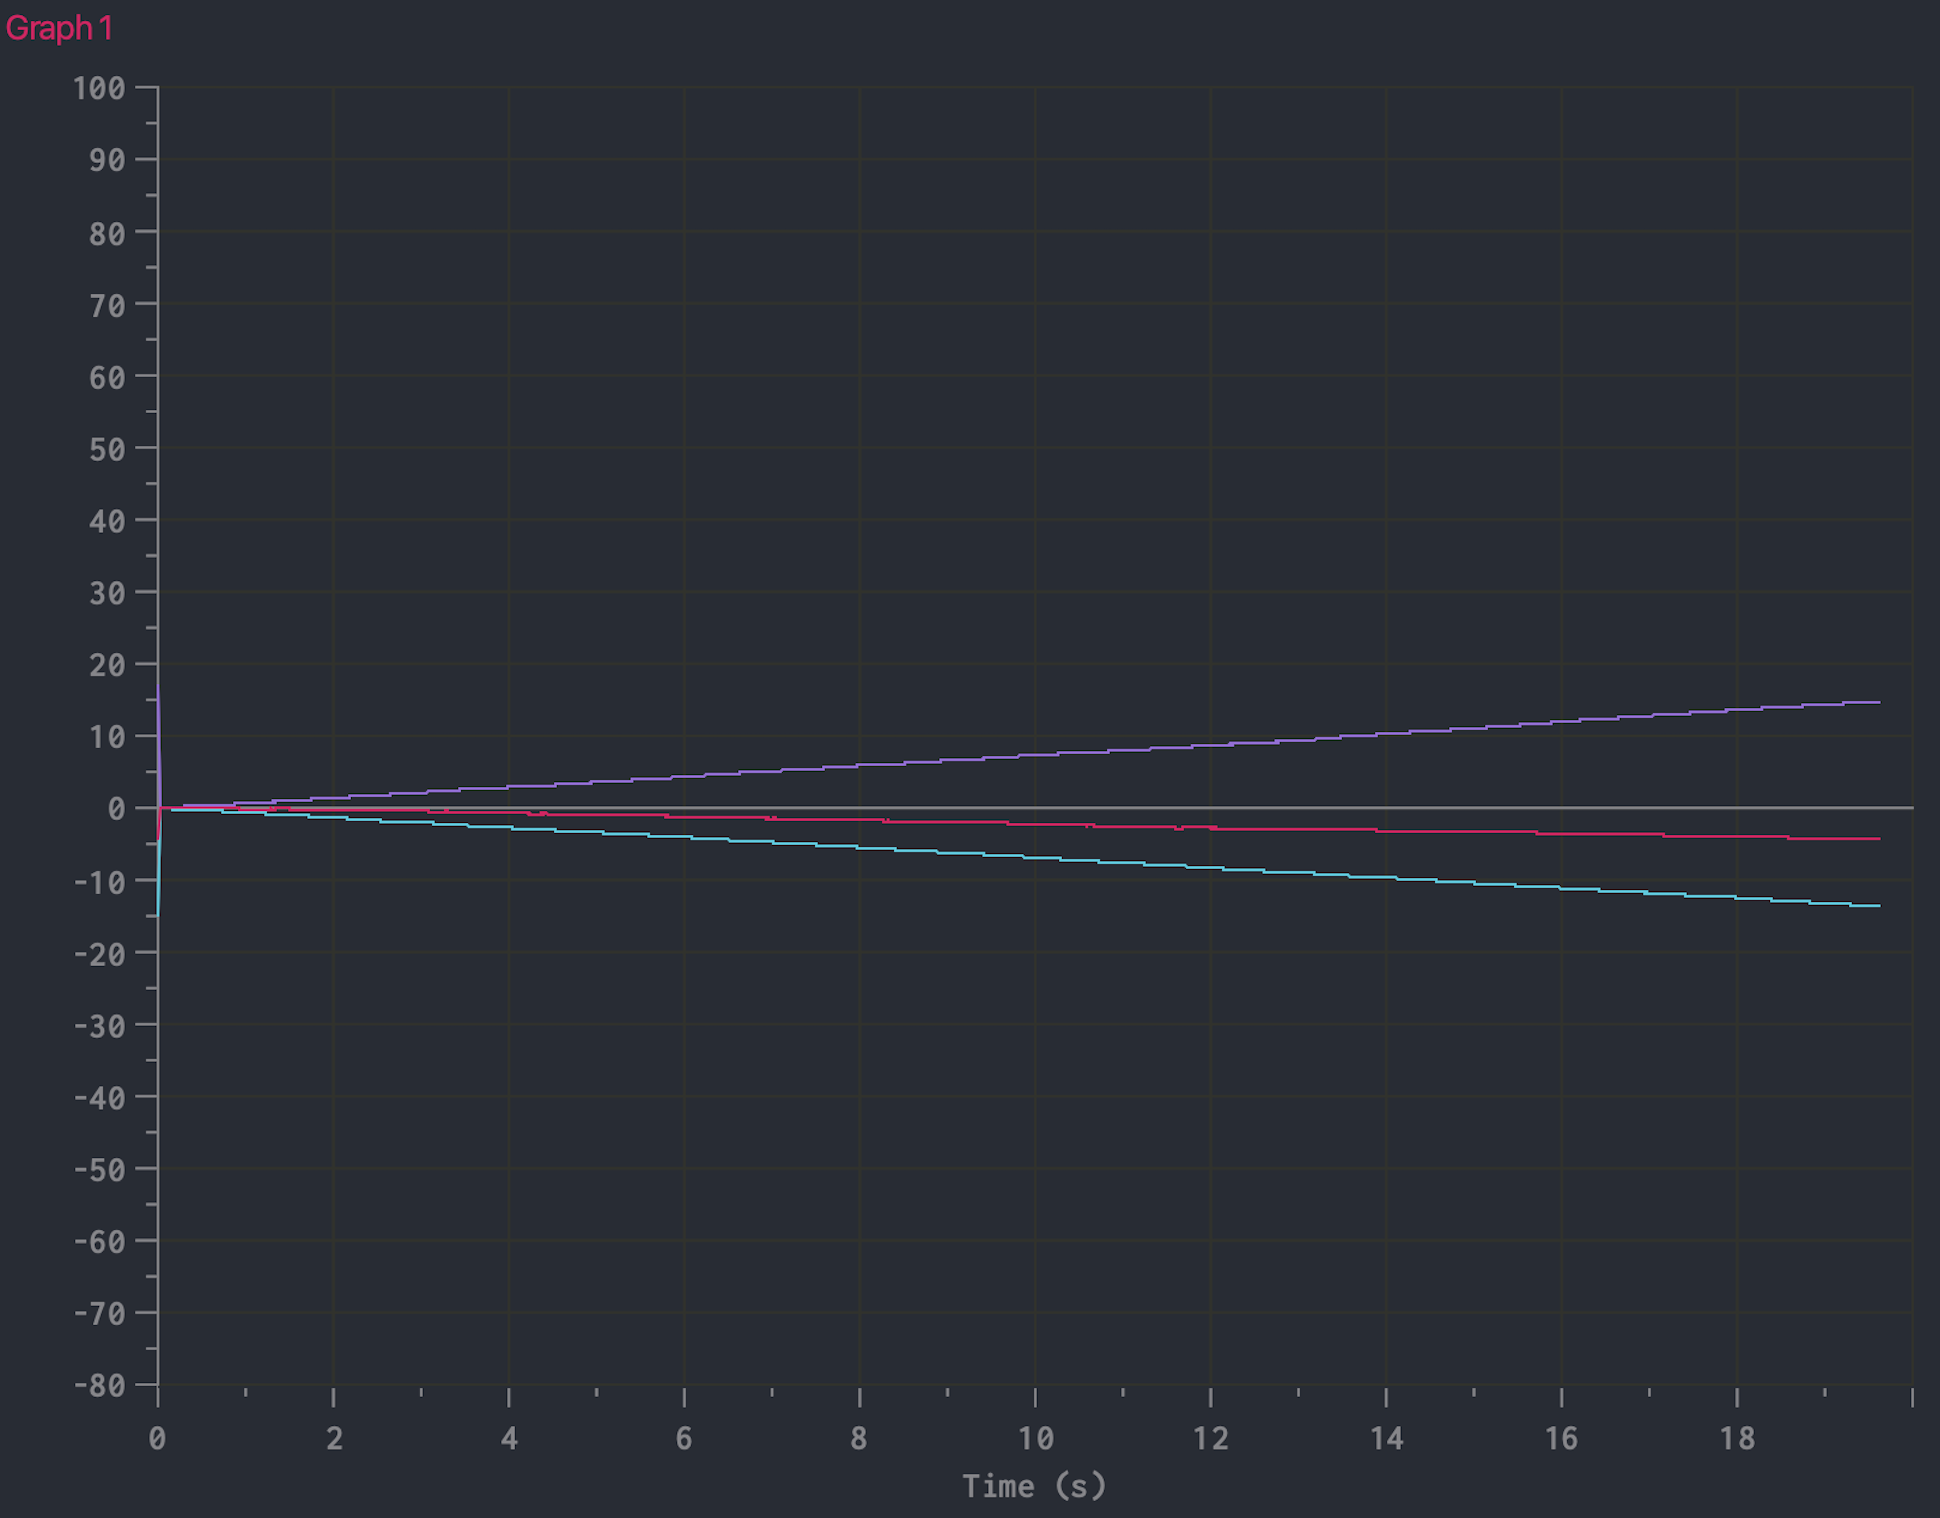
Even though the IMU was sitting flat on the table, the pitch angle changes over time at a constant rate. So while the angles given by the gyroscope is low noise, its readings are inaccurate due to drift.
To mitigate the inaccuracy of the gyroscope while keeping the noise low, we can use a complementary filter between the accelerometer and the gyroscope. That is, we average their data together so that we get the accuracy of the accelerometer while keeping the noise low using the gyroscope data. The code for implementing a complementary filter is the following.
To compare the angle data with and without the filter, I plotted the pitch and yaw with and without the filter (red/yellow curves represent filter data and purple/blue curves represent the unfiltered gyroscope data).
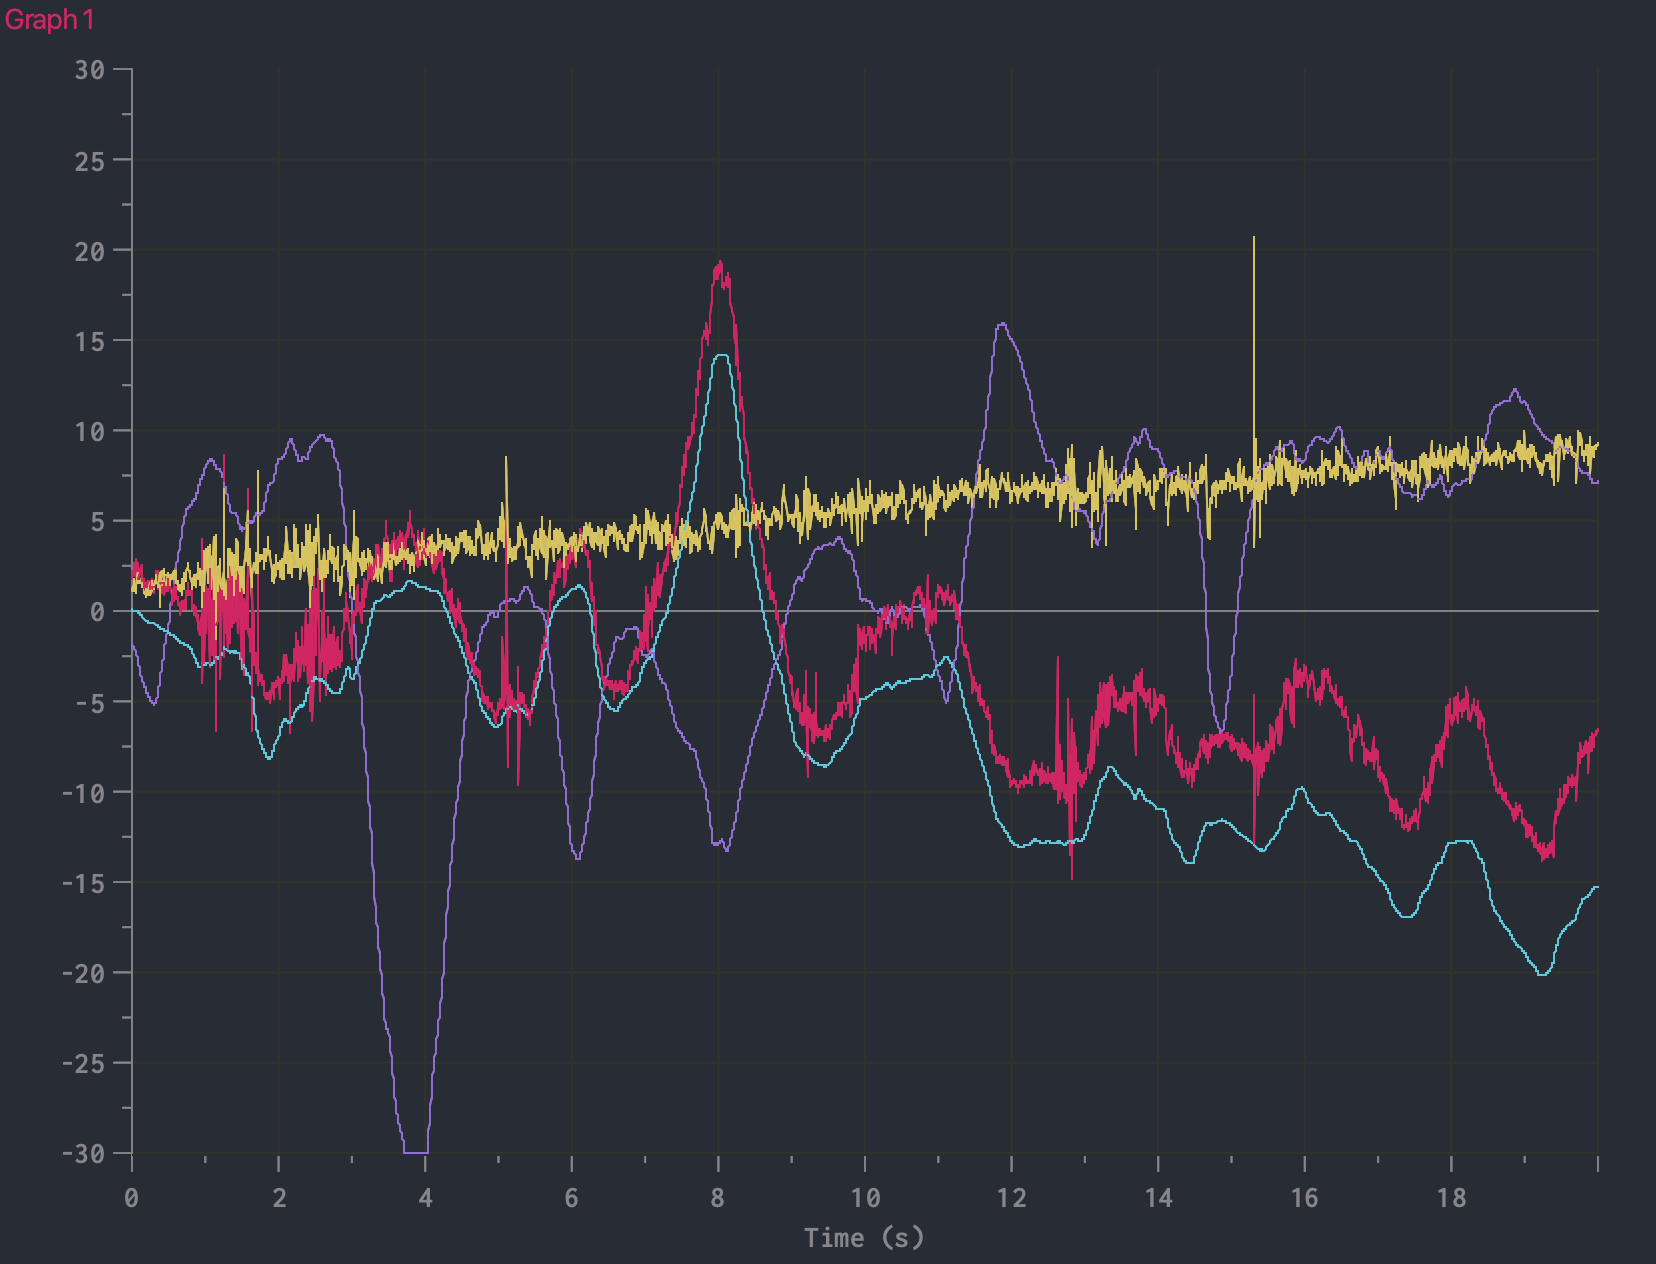
It can be seen that the filtered data is much noisier than the unfiltered data due to contribution from the angles computed from accelerometer data. However, it is on average more accurate than the unfiltered data due to less drift.
Collecting data into an array
As you can see in the previous code snippets, I only performed computations only when new sensor data was available. To test the speed of sampling, I printed out the time in milliseconds to the serial monitor. From the output, I was able to find that the IMU has a sampling rate of 3 milliseconds.
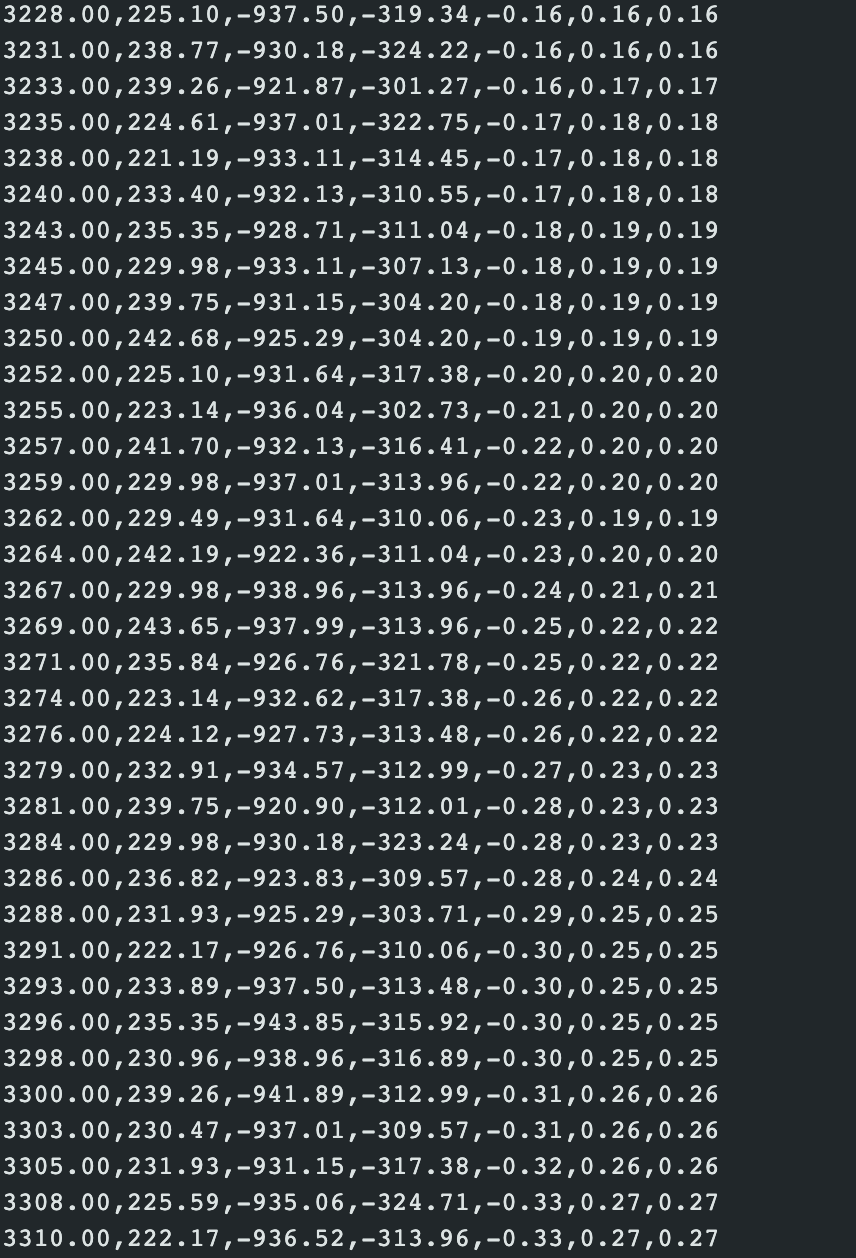
Next, I wrote code for a function that collects 100 timestamped IMU data into an array.
The following is the printed output of this function.
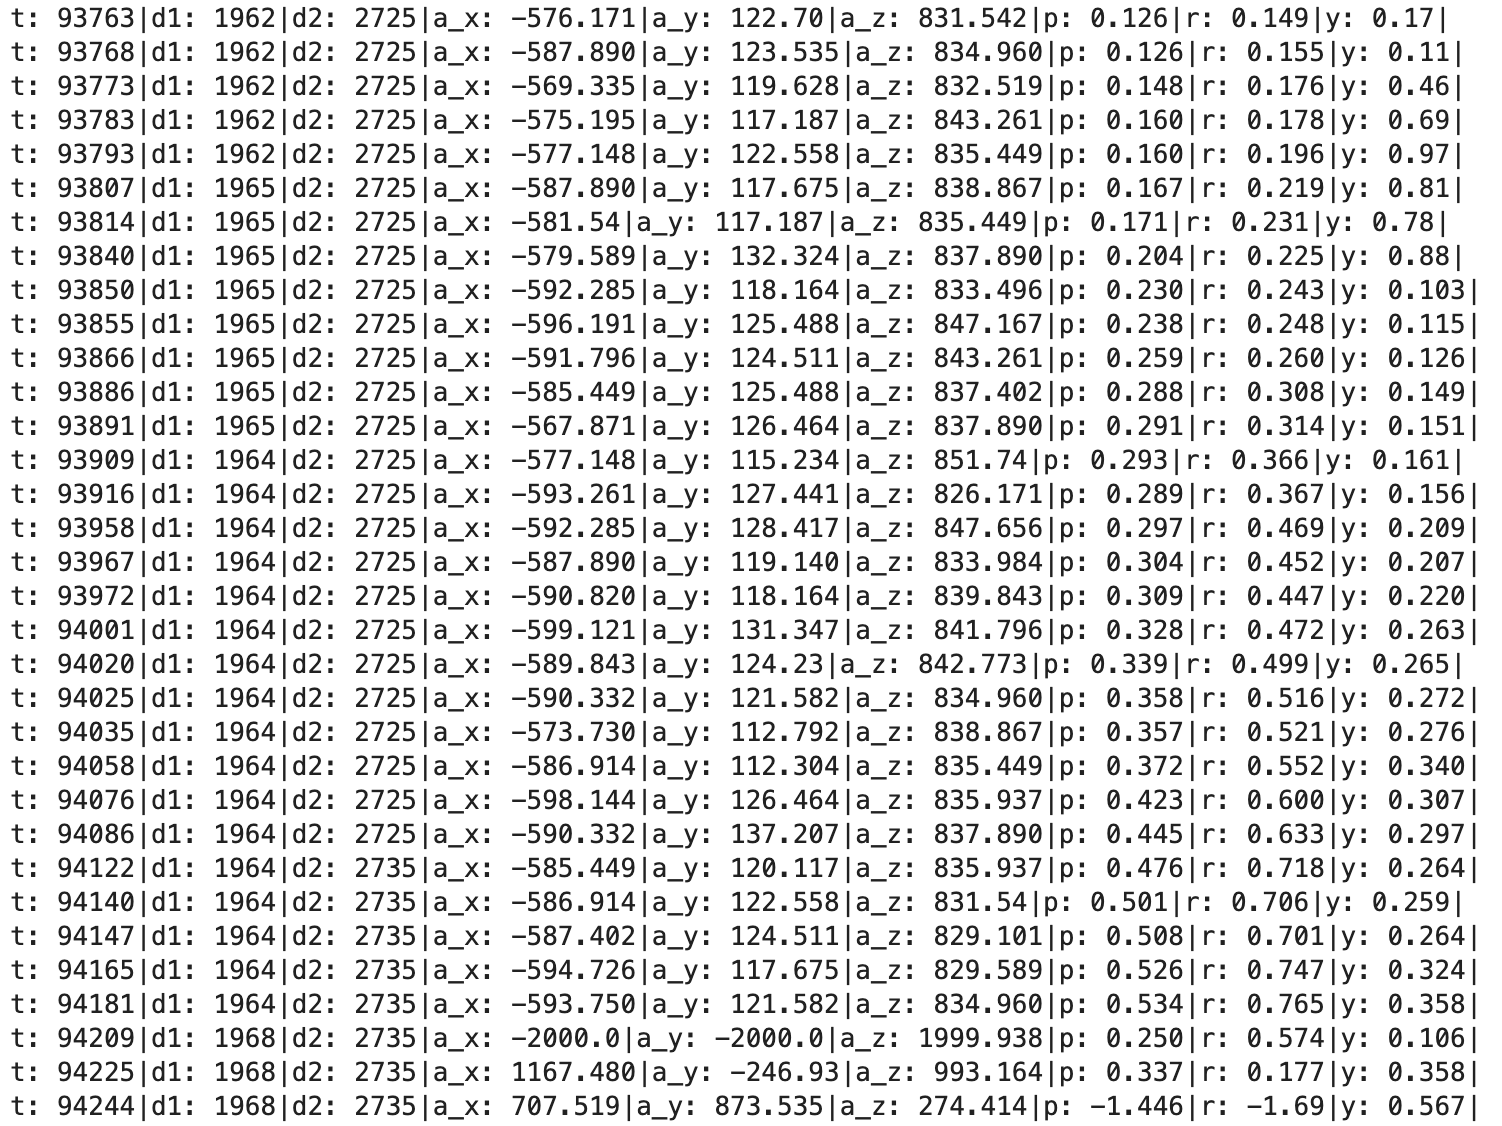
Next, I wrote code to store 5 seconds of timestamped ToF and IMU data into an array and sent it to my laptop over Bluetooth. The following is the code for sending 5 sceonds of ToF and IMU data.
I used Jupyter notebook to test this functionality and confirmed that it works.
Recording a stunt!
This week in lab, I received the RC robot that I will be using to build the robot in the next 8 labs. Here is a video of me performing stunts with the car.
Some observations about this RC car was that it is a lot faster than the typical RC car. This means that any latency may become a problem since the robot's state is changing so quickly. So it will be important that our code runs as efficiently as possible going forward.
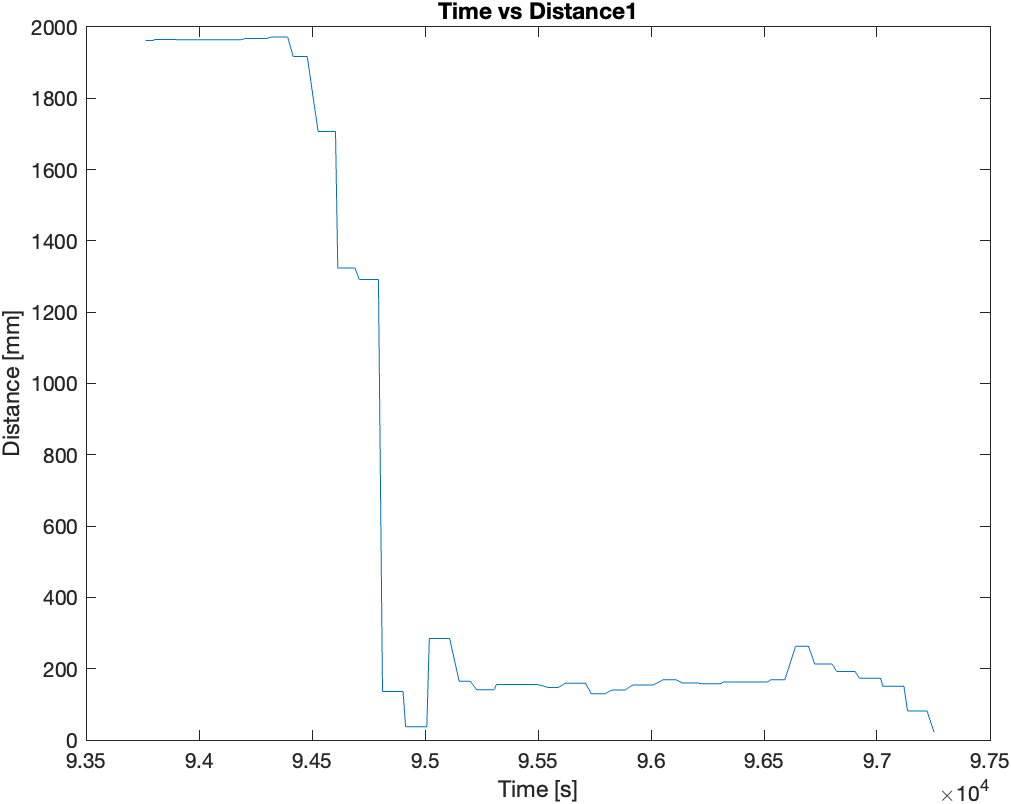
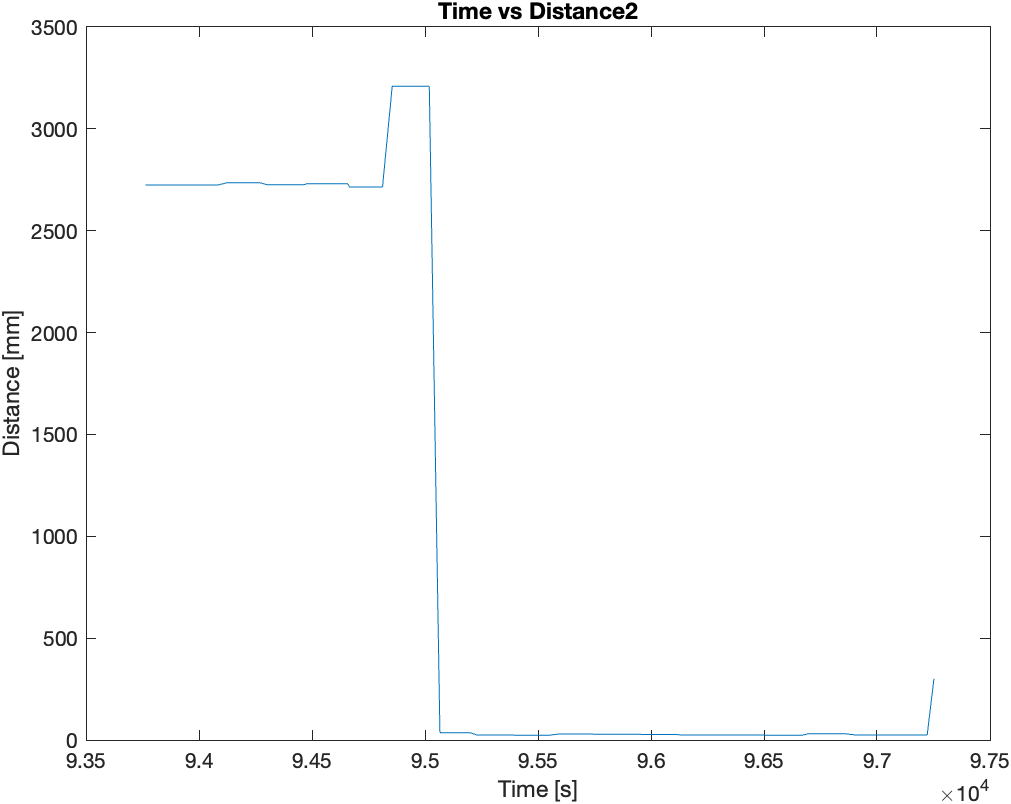
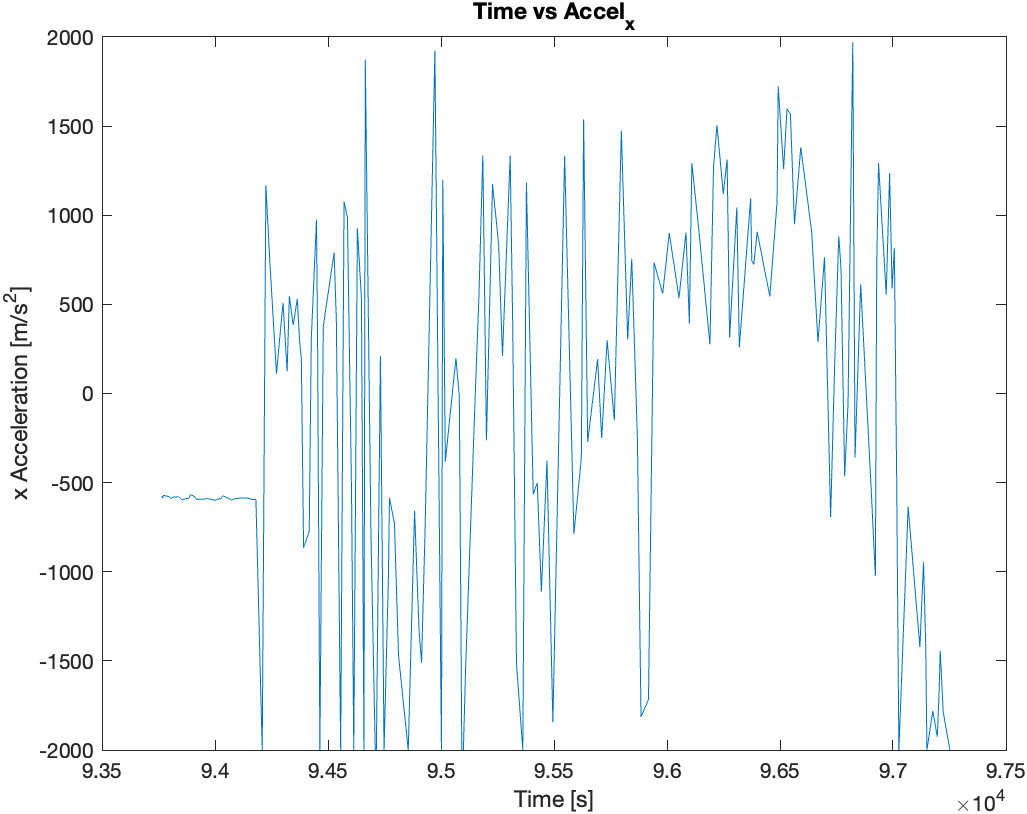
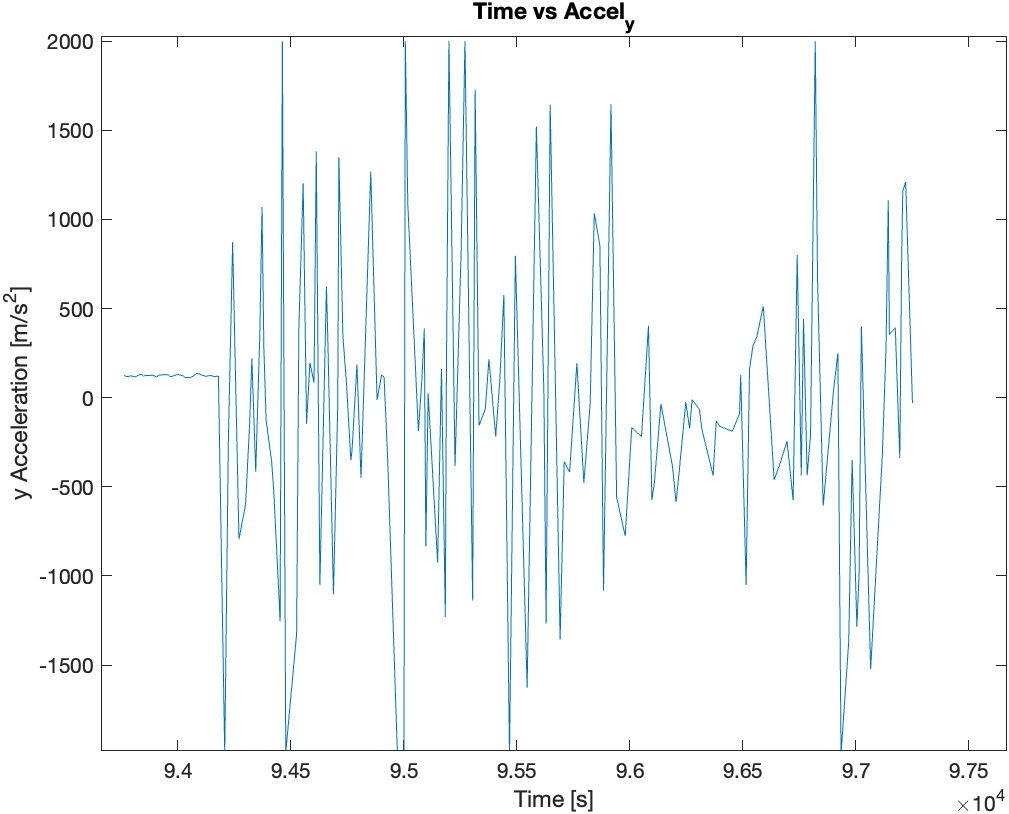
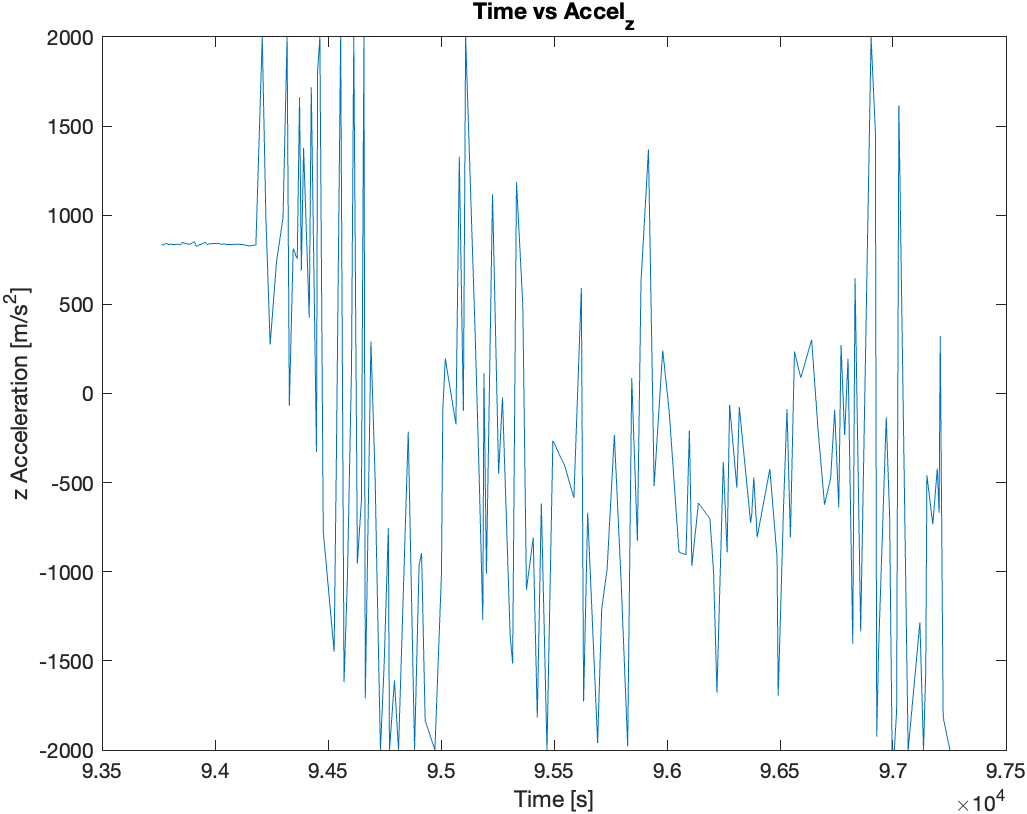
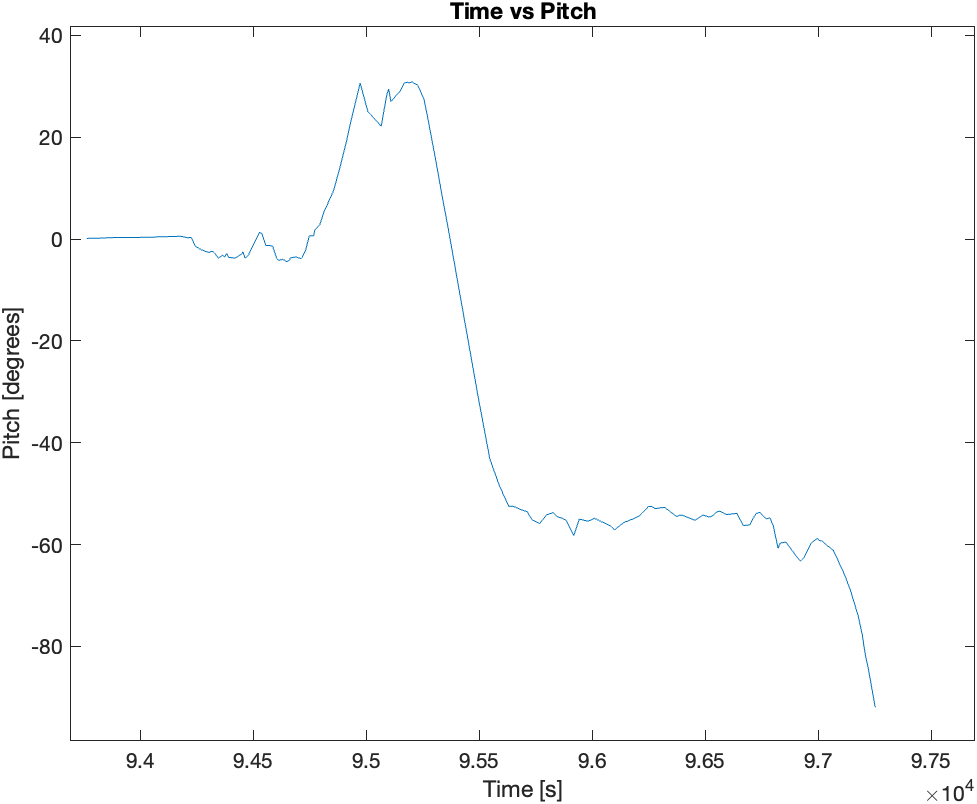
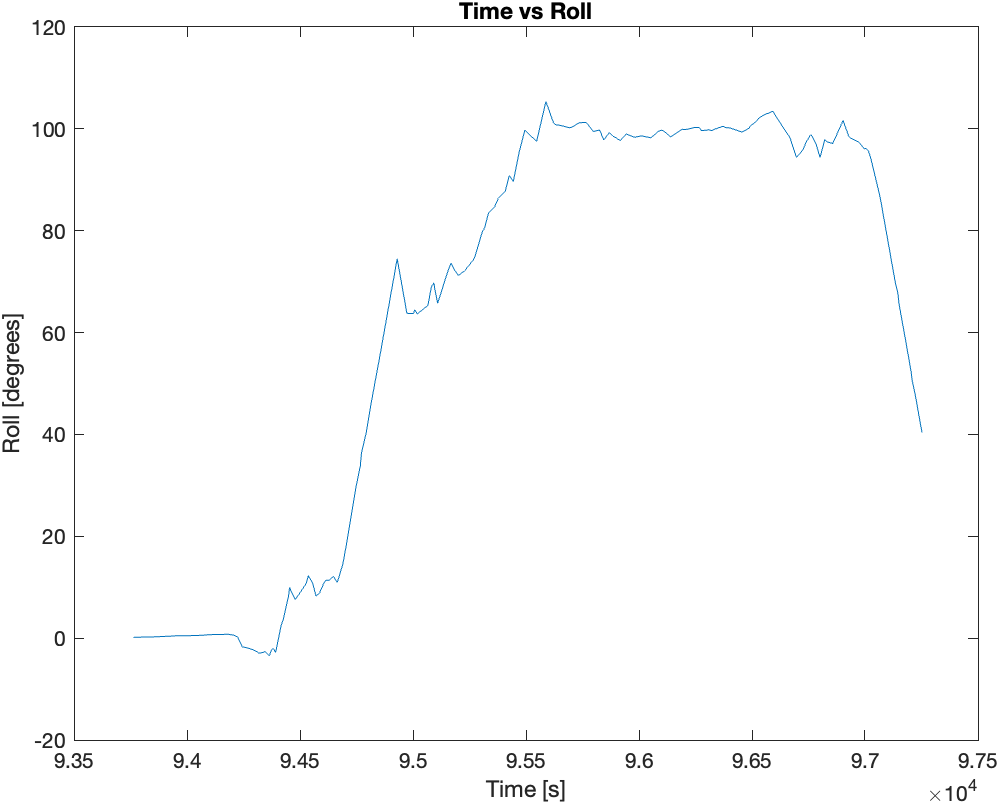
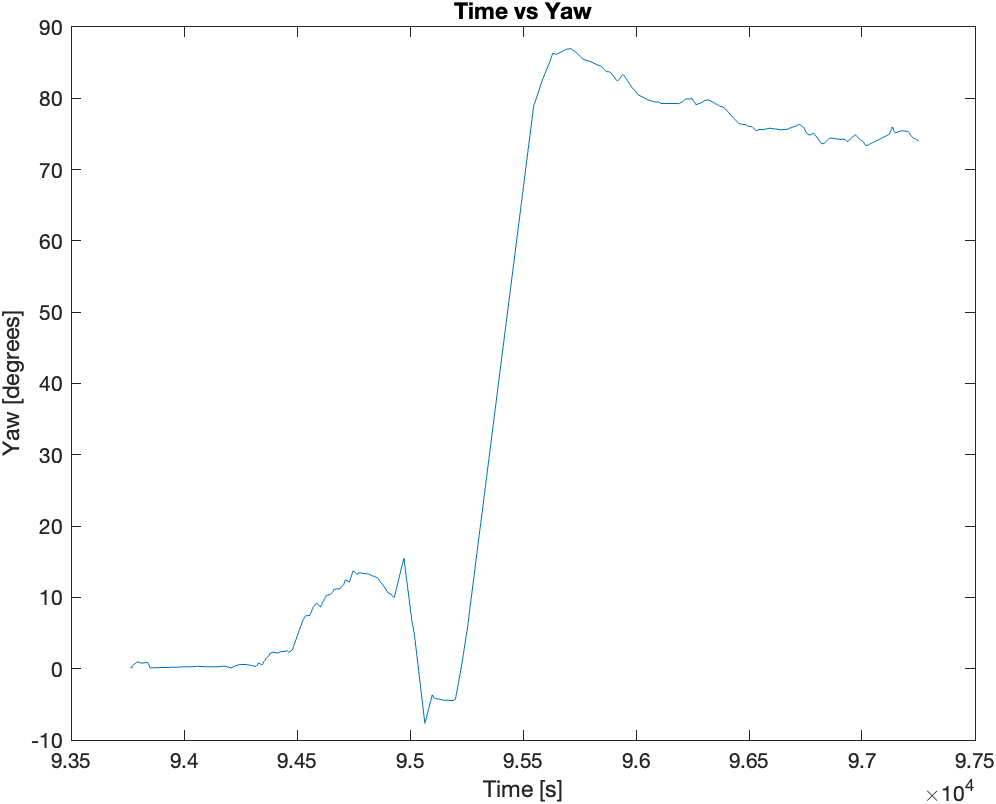
Then finally, I mounted the two sensors (IMU and ToF) on the the RC car and recorded sensor data for 5 seconds while the RC car performed stunts. Following are the plots of the sensor data recorded during the 5 seconds of stunts:
